Transformer Commissioning
Standard protocols, hidden failure modes, and the gap commissioning leaves open. Why a clean commissioning report is not the same as a healthy first year.


A power transformer commissioning program exists to answer one question: is this unit safe to energize?
Executive Summary
A rigorous program answers that question well. Commissioning does not, and cannot, answer a second question that matters just as much to the owner: will this unit survive its first year in service. Commissioning tests are point-in-time, de-energized, or low-voltage measurements taken before a transformer ever sees full load, real thermal cycling, or grid transients. Early-life failures happen precisely because of what commissioning cannot see: how the unit behaves once energized, loaded, and left alone.
The defects that end a transformer's first year are, for the most part, not defects of design or of age. They are introduced before the unit is ever energized. A manufacturing flaw that survived factory test. A winding assembly that shifted during a rail journey. Moisture drawn into cellulose during months of outdoor storage. Air left in the insulation by a vacuum hold cut short to meet a schedule. A core ground disturbed during assembly. A current transformer wired backward. Every one of them is present on the day the unit is energized.
Almost none of them is measurable on that day. A commissioning test asks whether a defect is detectable now, with the unit de-energized or at low voltage, at ambient temperature, under no load. Most of these defects are not. They become detectable only after the unit has carried current, cycled thermally, and vibrated continuously for weeks or months. By then the commissioning team has demobilized, the report is filed, and the next scheduled look at the asset may be six months or a year out. That asymmetry between when a defect is introduced and when it can be seen is the subject of this paper.
This paper follows the actual sequence of a commissioning program: the ground and land studies required before a transformer pad is ever poured, the standard commissioning protocols, the physical and chemical phenomena that cause delayed failures and are frequently overlooked, and the specific test-and-analysis techniques (SFRA interpretation and vacuum oil filling) that separate a compliant commissioning program from a rigorous one. It closes by describing where continuous, physics-based condition monitoring, applied from the day of energization forward, closes the gap that commissioning alone leaves open.
Ground Studies and Land Analysis
Before a transformer ever sees high voltage, the ground it sits on and the grid beneath it require the same rigor as the electrical commissioning of the unit itself. A power transformer is a major source of physical weight, sustained vibration, environmental oil hazard, and, during a fault, massive current.
1.1 Electrical Grounding Studies
A transformer needs a low-impedance path to earth to clear faults safely and protect personnel. An inadequate ground grid allows a system fault to energize the surrounding soil, creating lethal touch and step voltages. IEEE Std 80 governs.
Soil Resistivity Testing
Soil's ability to conduct electricity is measured with the Wenner four-electrode method: four equally spaced stakes are driven into the ground to inject current and measure voltage drop. Because moisture and temperature vary with depth, a multi-layer soil resistivity model is built rather than relying on a single surface reading.
The risk: if actual soil resistivity is higher than the original design assumed, due to dry sand, rock layers, or seasonal freezing, the grounding grid will fail to dissipate a fault quickly. This can destroy transformer neutrals and elevate local ground potential to dangerous levels.
The mitigation: measure across seasons where the climate allows it, and design to the worst-case resistivity rather than the survey-day value.
Ground Grid Resistance and Bonding Continuity
Two different measurements are involved here and they are routinely confused. They have different methods, different expected values, and different failure meanings.
Grid resistance to remote earth: measured by fall-of-potential. This is a property of the grid geometry and the soil. Large substation grids typically measure below 1 ohm, and specifications often call for 0.5 ohm or lower. IEEE Std 80 is explicit that a fixed resistance value is not the acceptance criterion. Touch and step voltage compliance is.
Tank-to-grid bonding continuity: measured by injecting a high DC test current, typically 10 to 30 amps, between the transformer tank ground pads and the main grid, and reading the voltage drop. A sound exothermic or welded connection reads in the milliohm range. A bonding path approaching a tenth of an ohm indicates a defective connection, not a marginal pass.
The risk: grounding risers missed or poorly welded during construction. Without a robust connection to the main grid, an internal fault will drive the entire metallic enclosure toward system voltage, causing flashovers and endangering anyone nearby.
1.2 Geotechnical and Structural Land Analysis
A large power transformer can weigh anywhere from 50 to over 500 tons. The foundation must be engineered to prevent movement over a service life of 40 years or more.
Geotechnical Soil Borings and Bearing Capacity
Deep core samples are drilled at the pad location to determine ultimate bearing capacity and settlement characteristics.
The risk: transformers vibrate continuously at twice the power line frequency, 120 Hz or 100 Hz, from magnetostriction in the core. Sustained vibration can compact or liquefy loose, unstable soils over time. Differential settlement, where one side of the pad sinks even half an inch relative to the other, imposes mechanical stress on internal winding structures, misaligns oil levels, and can crack rigid high-voltage bus ducts.
The mitigation: design the foundation to the manufacturer's stated levelness tolerance and establish a survey benchmark at commissioning so future settlement can be measured against a known datum rather than estimated.
Seismic Hazard Analysis
Local peak ground acceleration is mapped to design an adequate anchoring system.
The risk: a transformer is top-heavy, with a heavy oil-filled conservator tank and massive porcelain bushings sitting at the top. Seismic loading can snap an unanchored unit off its foundation or rupture oil containment valves.
1.3 Civil and Environmental Land Analysis
Large transformers hold tens of thousands of gallons of combustible, environmentally hazardous mineral oil. Civil containment systems must be fully certified before commissioning proceeds.
Oil Containment and Drainage Analysis
A spill containment pit is designed and tested directly beneath the transformer, typically a deep concrete basin filled with washed fire-quenching stone connected to an oil-water separator.
The risk: a catastrophic internal arc can rupture the tank wall. If the containment pit is cracked or unsealed, thousands of gallons of burning oil will flood the rest of the substation, destroying adjacent equipment and reaching the local water table.
The mitigation: a water-tightness test on the containment basin, and structural verification that emergency firewalls are sound where the transformer sits close to other critical infrastructure.
1.4 Ground and Land Study Checklist
Standard Commissioning Protocols
These are the baseline tests. Installation practice is governed principally by IEEE Std C57.93-2019, which covers the full range of power transformers including EHV units. Field test procedure is governed by IEEE Std C57.152. A transformer that has not cleared every item below should not be energized.
Insulation resistance and polarization index. Measures winding insulation health. Readings must be temperature-corrected to a common reference, normally 20 degrees C, before comparison to factory or prior values. A PI below roughly 1.5 signals possible moisture ingress or contamination in the paper insulation. Note the known limitation: on modern, very dry insulation the absorption current is small, and PI can read low on a healthy unit. Treat a low PI as a trigger for further testing, not as a verdict.
Winding and bushing power factor, or dissipation factor (tan delta). Measures dielectric loss in the winding insulation system and, separately, in each bushing. Record bushing C1 and C2 capacitance as a baseline. Later comparison against these recorded values is the primary method for detecting bushing degradation in service, and it is worthless if the baseline was never taken.
Transformer turns ratio and vector group verification. Confirms the internal windings were not damaged or shifted in transit and that phase relationships match the substation design.
Excitation current. Measured at each tap on the high-voltage winding. Sensitive to shorted turns, core defects, and tap changer contact problems that turns ratio alone will not reveal.
Winding resistance. Measured across all tap positions to catch loose internal connections or broken strands in the winding transposition. Values must be temperature-corrected before comparison to the factory test report. Phase-to-phase deviation above roughly 2 percent warrants investigation.
Core ground insulation resistance. The core is intentionally grounded at exactly one point. With the core ground link removed, megger the core to the tank to confirm the core is isolated everywhere else. This is the only commissioning test that addresses the core grounding failure modes discussed in Sections 6 and 7, and it is the test most often left off a commissioning checklist.
Leakage reactance, or short-circuit impedance. Compared against the nameplate and the factory test report. This is an independent electrical check on winding geometry and it complements SFRA rather than duplicating it.
Oil quality and dissolved gas analysis. A baseline fluid sample establishing dielectric breakdown strength per ASTM D877 or D1816, moisture content by Karl Fischer titration, power factor, interfacial tension, and dissolved gas levels before the unit sees voltage. Acceptance limits by voltage class are given in IEEE Std C57.106.
Sweep frequency response analysis. Covered in detail in Section 4.
Protection and control functional checks. Testing of the Buchholz relay, sudden pressure relays, winding and oil temperature indicators, and interlocking circuits.
Every one of these tests produces a single reading, or a small set of readings, taken once. None of them observe the transformer under sustained load, real ambient variation, or the mechanical stress of daily thermal cycling.
What Standard Tests Miss
These are the physical and chemical phenomena that cause failures months or years after a clean commissioning report. They are nuanced and easily overlooked, and none of them is well served by a single pass or fail reading.
3.1 Core Saturation and Residual Magnetism
Residual magnetism in a new transformer at commissioning does not usually come from a prior de-energization. It comes from the commissioning tests themselves. Winding resistance measurement injects DC into the winding. So does a tap changer resistance check. When the DC is removed, flux stays trapped in the core.
The risk: energizing with residual flux present allows that flux to add to the incoming system flux at an unfavorable point on the voltage wave, driving the core into deep saturation. The resulting inrush current can reach several times rated current, stressing the windings mechanically and triggering false protection operation.
The mitigation: perform a core demagnetization procedure with a variable DC supply after all DC-injection testing is complete, and before SFRA and energization. Sequence matters. Demagnetizing before the winding resistance test accomplishes nothing.
3.2 Core and Winding Mechanical Shifts in Transit
A transformer can look pristine from the outside while its internal, multi-ton winding assemblies have shifted or warped from low-frequency vibration during rail or road transport. Impact recorders fitted for shipment record acceleration events, but they do not report whether the winding moved.
The risk: geometric shifts alter the internal capacitance and inductance of the winding assembly. The unit may survive initial energization, but its ability to withstand a major external short circuit later in life is compromised.
The mitigation: sweep frequency response analysis, covered in Section 4, cross-checked against leakage reactance and winding resistance.
3.3 Static Electrification During Oil Filling
Pumping thousands of gallons of insulating oil into a large tank creates friction between the moving oil and the solid cellulose insulation, generating static charge. The oil's propensity to do this is a measurable property, its electrostatic charging tendency, and it can be specified and tested.
The risk: if oil is pumped too quickly, static charge accumulates on paper insulation surfaces faster than it can dissipate. It can discharge as an internal flashover through the oil, destroying insulation before the unit is ever connected to the grid.
The mitigation: meticulous tank grounding, oil flow velocities held below roughly one meter per second, correct vacuum-filling procedure, and a strict oil rest period of 24 to 48 hours before voltage is applied. Section 5 details the full vacuum-filling and moisture-removal process.
3.4 CT Saturation and Polarity Misalignment
Current transformers mounted inside the bushings feed current signals to the protective relays. Their ratio, polarity, and saturation behavior all have to be verified, not assumed from the nameplate.
The risk: a single CT winding wired backward, or a CT that saturates prematurely during a fault, causes the differential protection relay to interpret normal load current as an internal fault, or to miss a real one.
The mitigation: record the CT ratio and excitation, or knee-point, curve, then perform primary injection testing. Drive actual high current through the primary bushings and confirm that the current reaching the protection relays matches, in both magnitude and phase angle, what the calculation predicts.
Interpreting SFRA Graph Deviations
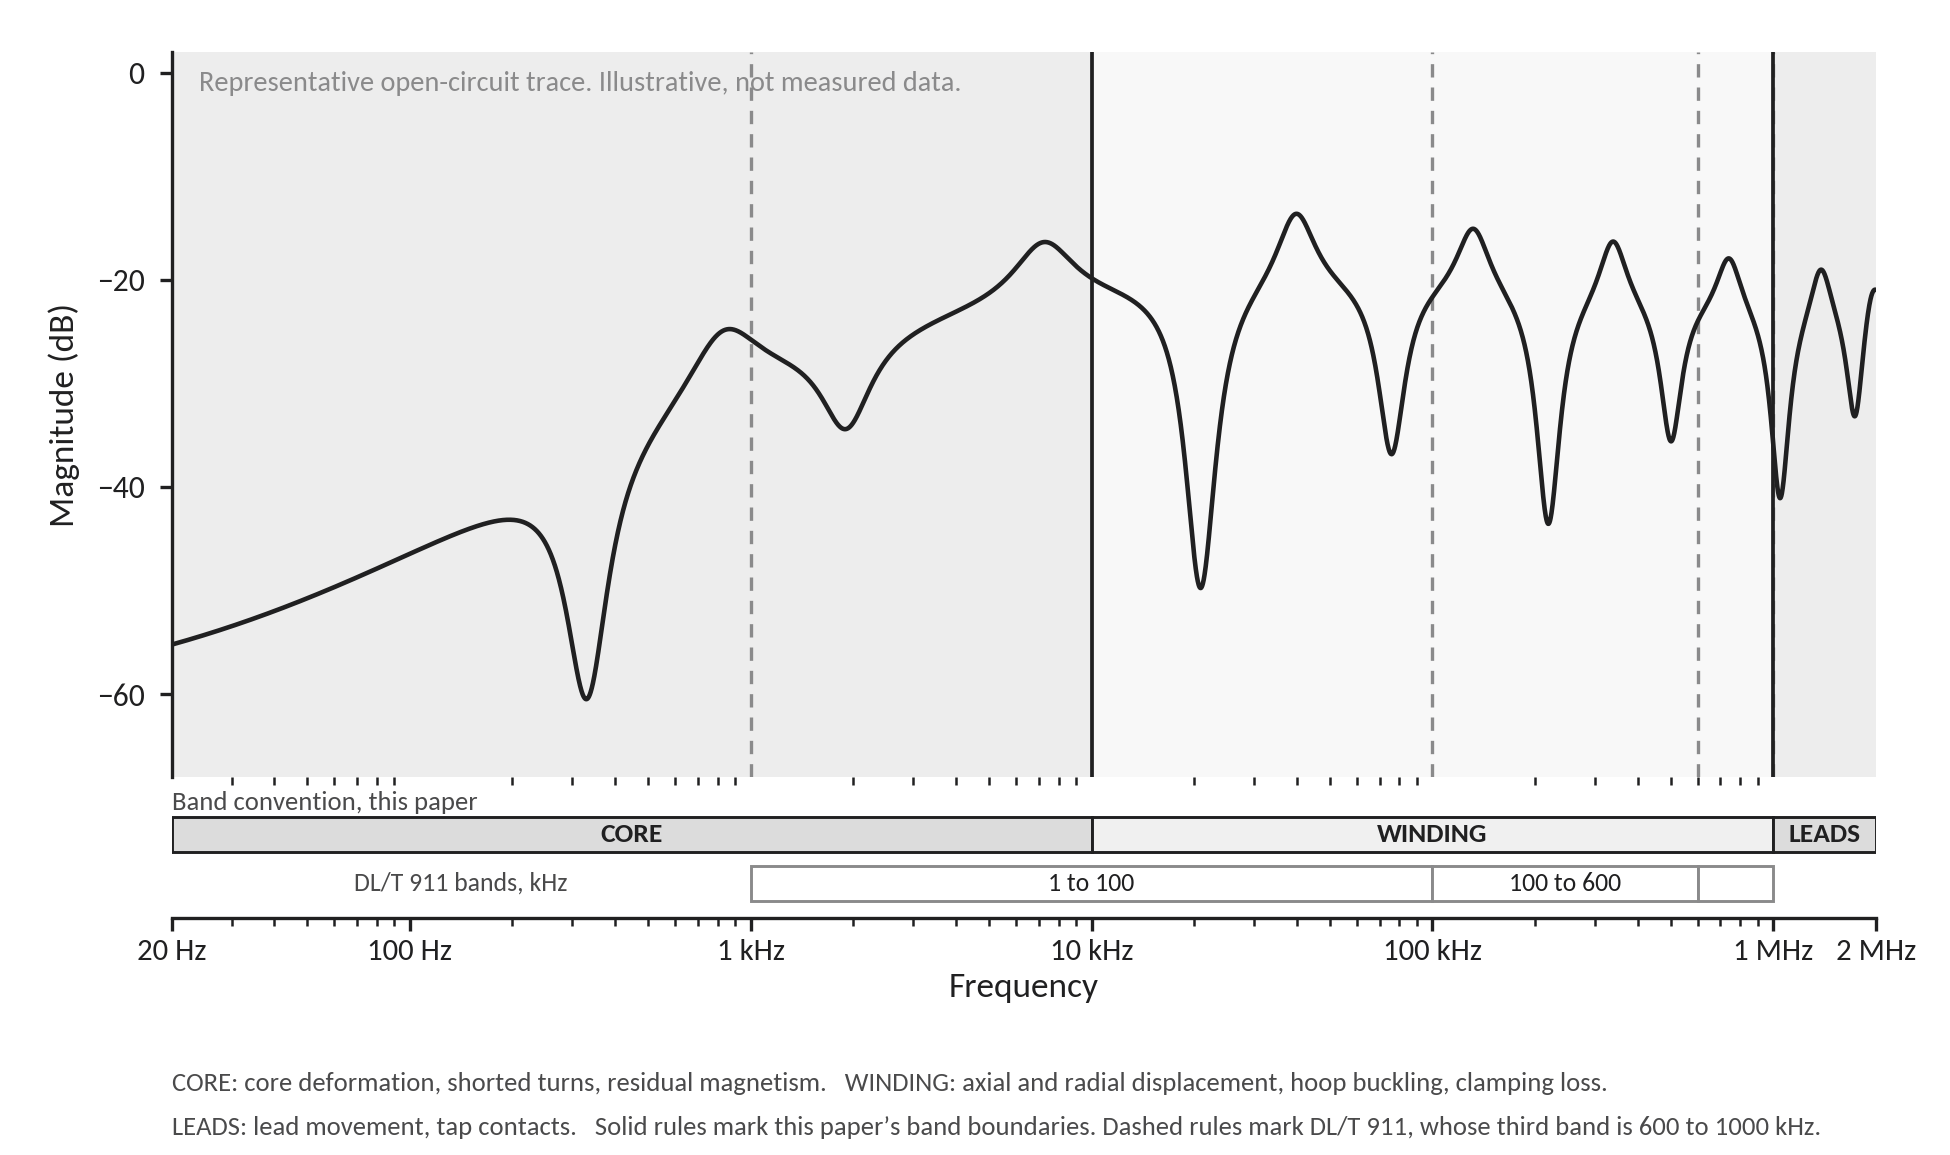
Sweep frequency response analysis injects a low-voltage swept sine signal, typically 20 Hz to 2 MHz, across the winding and measures the response. Because the winding-core assembly behaves as a distributed network of inductors, capacitors, and resistances, its frequency response is effectively a mechanical fingerprint. Any physical change in winding geometry shows up as a shift in that fingerprint, long before it would show up in DC resistance, turns ratio, or dissolved gas.
Measurement technique is specified in IEC 60076-18 and IEEE Std C57.149. Interpretation is not standardized to the same degree, and it is worth being clear about that. IEEE Std C57.149 and CIGRE TB 342 both rely on expert comparison rather than fixed numerical thresholds. The Chinese standard DL/T 911 does specify numerical thresholds, using a relative factor computed over bands of 1 to 100 kHz, 100 to 600 kHz, and 600 to 1000 kHz.
4.1 Reading the Frequency Bands
The band boundaries below reflect common field practice. They are not the bands used by DL/T 911. Whichever convention a program adopts, the commissioning record has to state which one it used.
Low frequency, roughly 20 Hz to 10 kHz: dominated by the core. Deviations here point to core deformation, shorted turns, or residual magnetism rather than winding movement. A large low-frequency shift with everything else stable usually means demagnetization was incomplete. Re-demagnetize and repeat before treating it as a defect.
Mid frequency, roughly 10 kHz to 1 MHz: dominated by winding-to-winding and winding-to-ground capacitance and the main winding inductance. This is the band most sensitive to axial and radial winding displacement, hoop buckling, and winding-to-winding movement. It is the band that matters most after a rough transport event or a through-fault.
High frequency, above roughly 1 MHz: dominated by the winding's internal geometry, lead and tap connections, and stray capacitance. Deviations here usually point to loose connections, lead movement, or tap changer contact issues rather than bulk winding shift. This band is also the most sensitive to test lead placement, so repeatability matters more here than anywhere else.
4.2 Quantifying the Deviation
Comparing the commissioning trace to the factory baseline should be done numerically, across each frequency band, not by eye alone. No IEEE or CIGRE document fixes threshold values for this. The tiers below are a working convention in wide field use, and VIE states them as a convention rather than as a standard requirement.
Correlation coefficient above 0.99 in a band: no significant mechanical change. Normal manufacturing and measurement variation.
Correlation coefficient between roughly 0.98 and 0.99: a caution zone. Investigate with a repeat measurement, a check of test lead connections and grounding, and comparison against sister-unit traces if available, before concluding there is a defect.
Correlation coefficient below roughly 0.98, particularly in the mid-frequency band: indicates a probable mechanical change. Cross-check against winding resistance, leakage reactance, turns ratio, and a visual or internal inspection before committing to energization.
If a commissioning program is contractually bound to a published standard, use the DL/T 911 relative factor over the DL/T 911 bands and say so in the specification. Mixing one standard's bands with another's thresholds produces a number that means nothing.
4.3 Common Deviation Signatures
A uniform vertical shift across all frequencies: usually a test setup or grounding artifact, not a transformer defect. Re-test before drawing conclusions.
A new resonance peak appearing in the mid-frequency band: classic signature of axial winding displacement or a partial short between adjacent turns.
Peak-frequency shift without amplitude change: consistent with a change in winding-to-winding capacitance, often from clamping pressure loss or minor radial movement.
Divergence that appears on one phase only: points to a localized, single-phase mechanical event rather than a design or manufacturing characteristic, and should be treated with more urgency than a deviation present on all three phases.
The value of SFRA is entirely comparative. A trace with no factory baseline and no sister-unit trace cannot be interpreted with confidence. The commissioning record should always state what the current trace is being compared against, which interpretation convention was applied, and the correlation coefficients per band. Not simply pass or fail.
Vacuum Filling and Moisture Calculation
Moisture is the single largest driver of dielectric failure in a new transformer, and it is introduced almost entirely during transport, storage, and the oil-filling step itself. The vacuum-filling process exists to remove both moisture and air from the cellulose insulation and the tank before the unit ever sees voltage.
5.1 The Vacuum-Filling Sequence
Step 1, leak test and evacuation: after a positive-pressure leak test, the tank is evacuated. As an example of typical practice, utility specifications commonly call for 133 Pa, which is 1 mbar or roughly 0.75 torr, or lower, held to confirm the vessel does not leak back above a specified rate over a set hold period. Some specifications add one hour of hold for every hour the internals were exposed to atmosphere. Manufacturer requirements govern and are frequently tighter than general guidance.
Step 2, hold under vacuum: the tank is held at deep vacuum for a duration driven by winding mass and insulation thickness, often 12 to 24 hours or more for large units, allowing moisture bound in the paper to migrate out as vapor.
Step 3, oil introduction under vacuum: dry, degassed oil is introduced from the bottom of the tank while vacuum is maintained on the vessel, at a controlled fill rate. Filling under vacuum, rather than at atmospheric pressure, prevents air from becoming trapped in the winding insulation and paper wraps, where it would otherwise become a partial-discharge site once the unit is energized.
Step 4, final vacuum hold and degassing: once full, the unit is held under vacuum again to allow any remaining entrained gas bubbles to rise out of the oil column. This is the step most often shortened under schedule pressure, and it is the step veteran commissioning engineers flag most consistently as non-negotiable.
Step 5, oil rest period: 24 to 48 hours minimum before energization, allowing static charge generated during filling to bleed to ground and allowing any microscopic bubbles to fully clear.
Two Vacuum Levels, Not One
Two different vacuum levels appear in this process, and specifications routinely confuse them. The tank vacuum described in Step 1 is measured in the range of a fraction of a torr. The oil processing plant that dries and degasses the oil before it enters the tank operates at a much deeper vacuum, commonly specified below 100 microns of mercury, which is 0.1 torr, and often below 10 microns. These numbers differ by two orders of magnitude because they describe different vessels doing different jobs. A specification that gives a single vacuum figure without saying which vessel it applies to is ambiguous and should be corrected before the crew mobilizes.
The Limit of a Cold Vacuum Hold
One point is frequently missed. The latent heat of vaporization cools the insulation as moisture evolves out of it. Below roughly 4 torr, water at the resulting surface temperature can freeze, and once it freezes, further pumping removes almost nothing. Extended cold vacuum therefore has diminishing returns, and a crew that responds to a slow-recovering vacuum by simply holding longer may be accomplishing very little. Heat has to be added: hot oil circulation, low-frequency heating, or vapor-phase drying for units carrying significant moisture.
5.2 Calculating Moisture Content and Target Levels
Moisture is tracked two ways during and after filling: directly in the oil, and indirectly in the paper insulation. At equilibrium the paper holds far more water than the oil, on the order of hundreds of times more by weight fraction. That ratio is strongly temperature-dependent and rises as temperature falls, so it should be read off an equilibrium chart at the measured oil temperature rather than treated as a fixed number.
Oil moisture by Karl Fischer titration: reported in parts per million by weight. New, properly processed oil in a large power transformer should test below roughly 10 ppm at fill. Acceptance thresholds by voltage class are given in IEEE Std C57.106 and should be cited by clause in the specification rather than carried as a rule of thumb.
Percent saturation: because water solubility in oil rises sharply with temperature, raw ppm alone is not meaningful without the oil temperature at the time of sampling. Percent saturation, the measured ppm divided by the oil's saturation limit at that temperature, is the number that should actually be tracked and trended over time.
Estimating paper moisture from oil moisture: equilibrium curves, commonly presented as Oommen or similar moisture-equilibrium charts, relate oil ppm and temperature to the equivalent percent moisture by dry weight in the cellulose. These curves assume equilibrium, which a recently filled unit has not reached, so a value derived from a fill-day oil sample is an estimate and should be recorded as one. A target for new, properly dried insulation is below 0.5 percent moisture by dry weight in the paper. Above roughly 2 percent, cellulose aging accelerates significantly and the dielectric strength margin under load falls.
Vacuum level as a moisture proxy: during the dry-out hold, a vacuum that holds steady rather than continuing to degrade is evidence that moisture evolution has substantially completed. A vacuum that keeps degrading means the insulation is still releasing moisture. The correct response is not simply a longer cold hold, for the freezing reason given in Section 5.1. It is a longer hold with heat applied, and a re-evaluation of whether the unit needs a full drying process rather than a fill-day evacuation.
The golden rule applies here more than anywhere else in commissioning. The physical time required for bound moisture to migrate out of multi-inch-thick pressboard, and for microscopic bubbles to rise out of a multi-thousand-gallon oil column, cannot be compressed by a tighter project schedule. Every shortened vacuum hold is a decision to accept elevated early-life failure risk in exchange for schedule.
What Could Go Wrong and How to Avoid It
The golden rule of commissioningNever rush the vacuum hold and oil rest phases. The physical time required for microscopic air bubbles to rise out of the oil and for static charges to dissipate cannot be accelerated by a tight project schedule.
Why Commissioning Cannot See These Defects
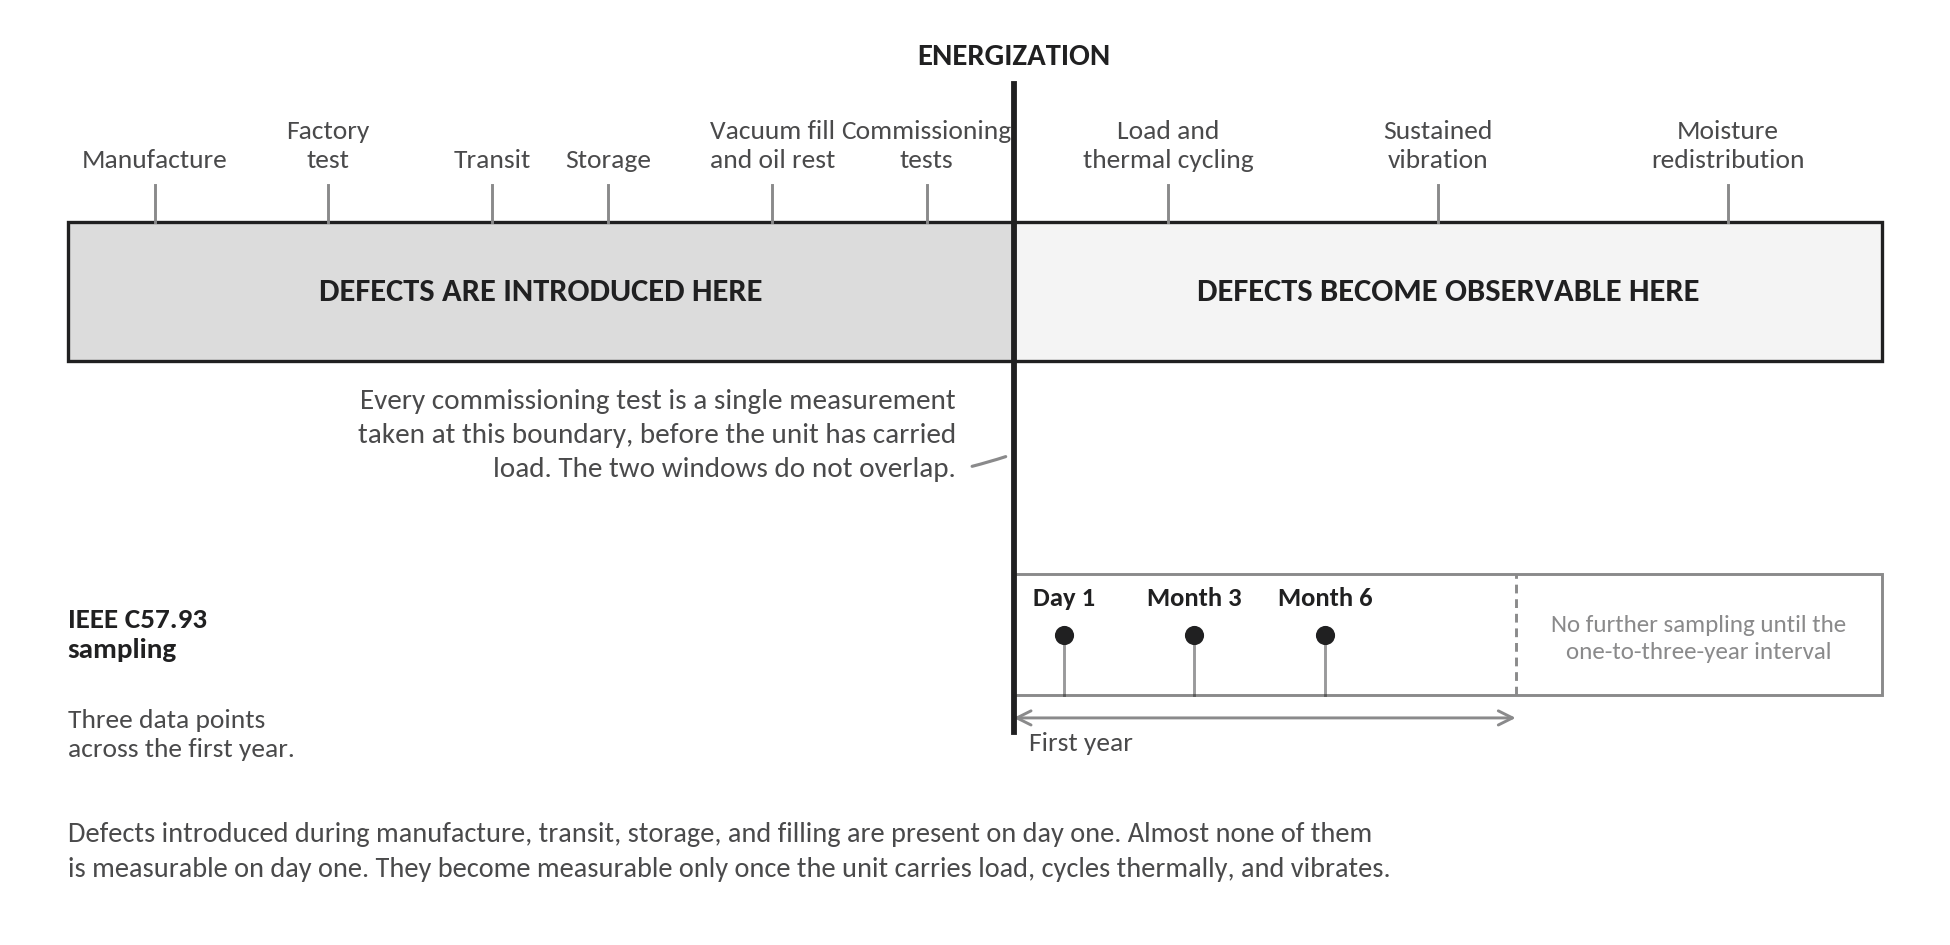
Every test in Sections 2 through 6 shares one structural property. Each is a single measurement, taken once, with the unit de-energized or at low voltage, at ambient temperature, before it has carried load. That is not a flaw in the tests. It is what commissioning was built to do, and it does it well. It does mean that a whole class of defect passes through commissioning undetected, not because the test was performed badly but because the defect is not yet expressed in anything the test can measure.
The pattern is consistent across the failure modes described above. The defect is introduced during manufacture, transport, storage, or filling. It is physically present on the day of energization. It becomes measurable only once load current, thermal cycling, and sustained vibration act on it. Commissioning sits at the boundary between those two windows, and it can only look backward.
7.1 Defect Origin and Detection Window
7.2 The Sampling Interval
The standard of care after energization is periodic fluid sampling. IEEE Std C57.93 recommends that a new critical transformer be sampled for dissolved gas and moisture after the first day, at three months, at six months, and thereafter at one-to-three-year intervals. That is a sound schedule and it reflects decades of practice.
It is also three data points across the first year. Each one is a snapshot of processes that run continuously: gas generation from a developing hot spot, moisture redistribution between paper and oil, mechanical loosening under vibration. A defect that begins developing in week three and produces measurable gas in week eleven is invisible until the month-three sample, and its rate of development is unknown even then, because a single sample gives a level and not a trend. Two samples three months apart give a trend across an interval in which the operating condition of the unit changed many times.
None of this is an argument against sampling. It is an argument that sampling alone cannot resolve the development of a defect on the timescale over which these defects actually develop.
7.3 The Same Limitation, Stated Concretely
A transformer that passes insulation resistance, polarization index, turns ratio, excitation current, winding resistance, power factor, core ground insulation, leakage reactance, dissolved gas analysis, SFRA, and every protection check can still fail in month four, because:
A winding clamping structure that reads perfectly correlated on a de-energized SFRA trace can still loosen incrementally under the first several hundred thermal expansion and contraction cycles once the unit is carrying real load.
A marginal connection that passes a static winding resistance measurement at ambient temperature can develop a hot spot only once it is carrying rated current and cycling with daily and seasonal ambient swings.
A core ground connection that is mechanically intact at commissioning can loosen or fatigue under sustained 100 to 120 Hz vibration. The consequence depends on how it fails. A lost or intermittent core ground leaves the core floating, which produces electrostatic buildup and sparking to the tank. An additional unintended ground path, from a displaced lead or from debris, creates a closed loop and produces circulating currents and localized heating. Both generate gas. Neither is visible to a one-time baseline.
Moisture that reads acceptable in the oil at fill, per Section 5, continues to migrate between paper and oil for months after energization as the unit heats and cools. A single post-energization sample captures one point in that migration and cannot show its direction.
Commissioning verifies a snapshot. It was never designed to observe a trajectory. Closing this gap requires instrumentation that watches the transformer continuously through the window in which these latent defects turn into failures.
How VIE Closes the Gap
VIE Technologies Inc. provides continuous, non-invasive, physics-based transformer health monitoring built on four-signal sensor fusion: triaxial vibration, thermal signature, magnetic field, and local weather. The architecture is designed specifically to observe the right-hand side of Figure 2, starting the moment a unit is energized and continuing for the life of the asset.
8.1 Extending the SFRA Question Into Live Operation
SFRA answers whether the winding geometry has shifted, but only at the moment of the test, with the unit de-energized. VIE's triaxial vibration sensing observes the mechanical signature of the energized, loaded winding and core assembly continuously. A winding clamping structure loosening gradually under live thermal cycling appears as a drifting vibration signature well before it would produce a measurable SFRA deviation at the next scheduled maintenance outage, and long before it produces an electrical fault. VIE does not replace SFRA. It picks up where the de-energized snapshot leaves off.
8.2 Catching What a Sampling Schedule Cannot
Section 7.2 set out the sampling schedule IEEE Std C57.93 recommends for a new critical unit: day one, three months, six months. Three data points across the first year, each one a snapshot of processes that run continuously. VIE's continuous thermal and vibration monitoring is built to flag the physical precursors to gassing, specifically developing hot spots from loosening connections and abnormal mechanical signatures from a degrading core ground, before they progress to the point of producing measurable dissolved gas. Because the architecture is physics-based rather than dependent on a learned baseline, it does not need months of historical data on a given unit to establish what normal looks like. It can flag deviation from expected physical behavior from the first days of energization, which is precisely the window in which the defects catalogued in Table 3 are developing and in which sampling density is lowest.
8.3 Distinguishing Real Faults from Normal Variation
The local weather signal in VIE's four-signal fusion solves a specific problem. A transformer's vibration, thermal, and magnetic signatures all vary with ambient temperature, wind loading on radiators, and seasonal load. Without that context, a monitoring system risks either false alarms on hot summer days or missed detections written off as normal weather variation. Correlating all three physical signals against local weather lets VIE separate a genuine developing defect, of exactly the kind catalogued in Table 3, from routine environmental and loading variation. That matters most during the noisy first year of a unit's life, when commissioning teams and operations staff can least afford to chase phantom alarms.
8.4 Fleet-Level Visibility During the Highest-Risk Window
Utilities and IPPs commissioning multiple units on a similar schedule, whether a substation rebuild, a data center campus buildout, or a multi-site rollout, face the same exposure across every unit simultaneously. VIE's fleet-level monitoring, deployed across more than 1,000 transformers and 3 gigawatts under management, gives operations and engineering teams a single view across every newly energized unit during its highest-risk window. That replaces reliance on the next scheduled maintenance outage, often 6 to 12 months out, to catch a developing failure.
8.5 A Non-Invasive Complement, Not a Replacement
VIE's sensors are non-invasive and physics-based by design. They observe the transformer from the outside using vibration, thermal, and magnetic signatures rather than requiring an internal connection or an outage to install. That makes continuous post-commissioning monitoring practical to deploy at the exact moment it matters most: immediately after the commissioning team signs off and the unit is turned over to operations, when the standard test protocols have finished asking their one-time questions and the transformer's real operating life begins.
Conclusion
A clean commissioning report confirms that a transformer is safe to energize. It does not confirm that the unit will survive the year that follows. The standard tests, insulation resistance and polarization index, power factor, turns ratio, excitation current, winding resistance, core ground insulation, leakage reactance, dissolved gas analysis, and protection checks, along with the residual magnetism, transit-induced mechanical shift, static electrification, and CT polarity considerations in Section 3, all address defects that are detectable in a single measurement taken before or at the moment of energization.
The defects that end a first year are introduced before energization and become measurable only after it. Manufacturing flaws that survive factory test, windings displaced in transit, moisture drawn in during storage, air left by a shortened vacuum hold, a disturbed core ground. Each is present on day one and each requires load, heat, and vibration to express itself. Commissioning sits on the wrong side of that boundary. It verifies a snapshot. It was never designed to observe a trajectory.
Rigorous commissioning, including careful SFRA interpretation against a factory baseline and a correctly sequenced vacuum-fill and moisture-removal process, remains the non-negotiable foundation. Closing the gap on top of that foundation requires continuous, physics-based observation of the transformer once it is live. That is exactly what VIE's four-signal sensor fusion is built to do.
References
Edition years below were verified in August 2026.
- IEEE Std 80-2013, Guide for Safety in AC Substation Grounding.
- IEEE Std C57.93-2019, Guide for Installation and Maintenance of Liquid-Immersed Power Transformers. Supersedes the earlier C57.12.11 and C57.12.12 installation guides and covers the full range including EHV.
- IEEE Std C57.152-2013, Guide for Diagnostic Field Testing of Fluid-Filled Power Transformers, Regulators, and Reactors. Source for insulation resistance, polarization index, power factor, and winding resistance field procedure.
- IEEE Std C57.104-2019, Guide for the Interpretation of Gases Generated in Mineral Oil-Immersed Transformers.
- IEEE Std C57.106-2015, Guide for Acceptance and Maintenance of Insulating Mineral Oil in Electrical Equipment. Source for oil moisture acceptance limits by voltage class.
- IEEE Std C57.149-2012, Guide for the Application and Interpretation of Frequency Response Analysis for Oil-Immersed Transformers.
- IEC 60076-18:2012, Power Transformers, Part 18: Measurement of Frequency Response.
- DL/T 911-2016, Frequency Response Analysis on Winding Deformation of Power Transformers. Supersedes DL/T 911-2004.
- CIGRE Technical Brochure 342, Mechanical Condition Assessment of Transformer Windings Using Frequency Response Analysis, WG A2.26, 2008.
- ASTM D877 and ASTM D1816, Standard Test Methods for Dielectric Breakdown Voltage of Insulating Liquids Using Disk Electrodes and Using VDE Electrodes.