Stranded Capacity
Why the capacity you already own is disappearing. What's driving the squeeze. How VIE recovers it, asset by asset.

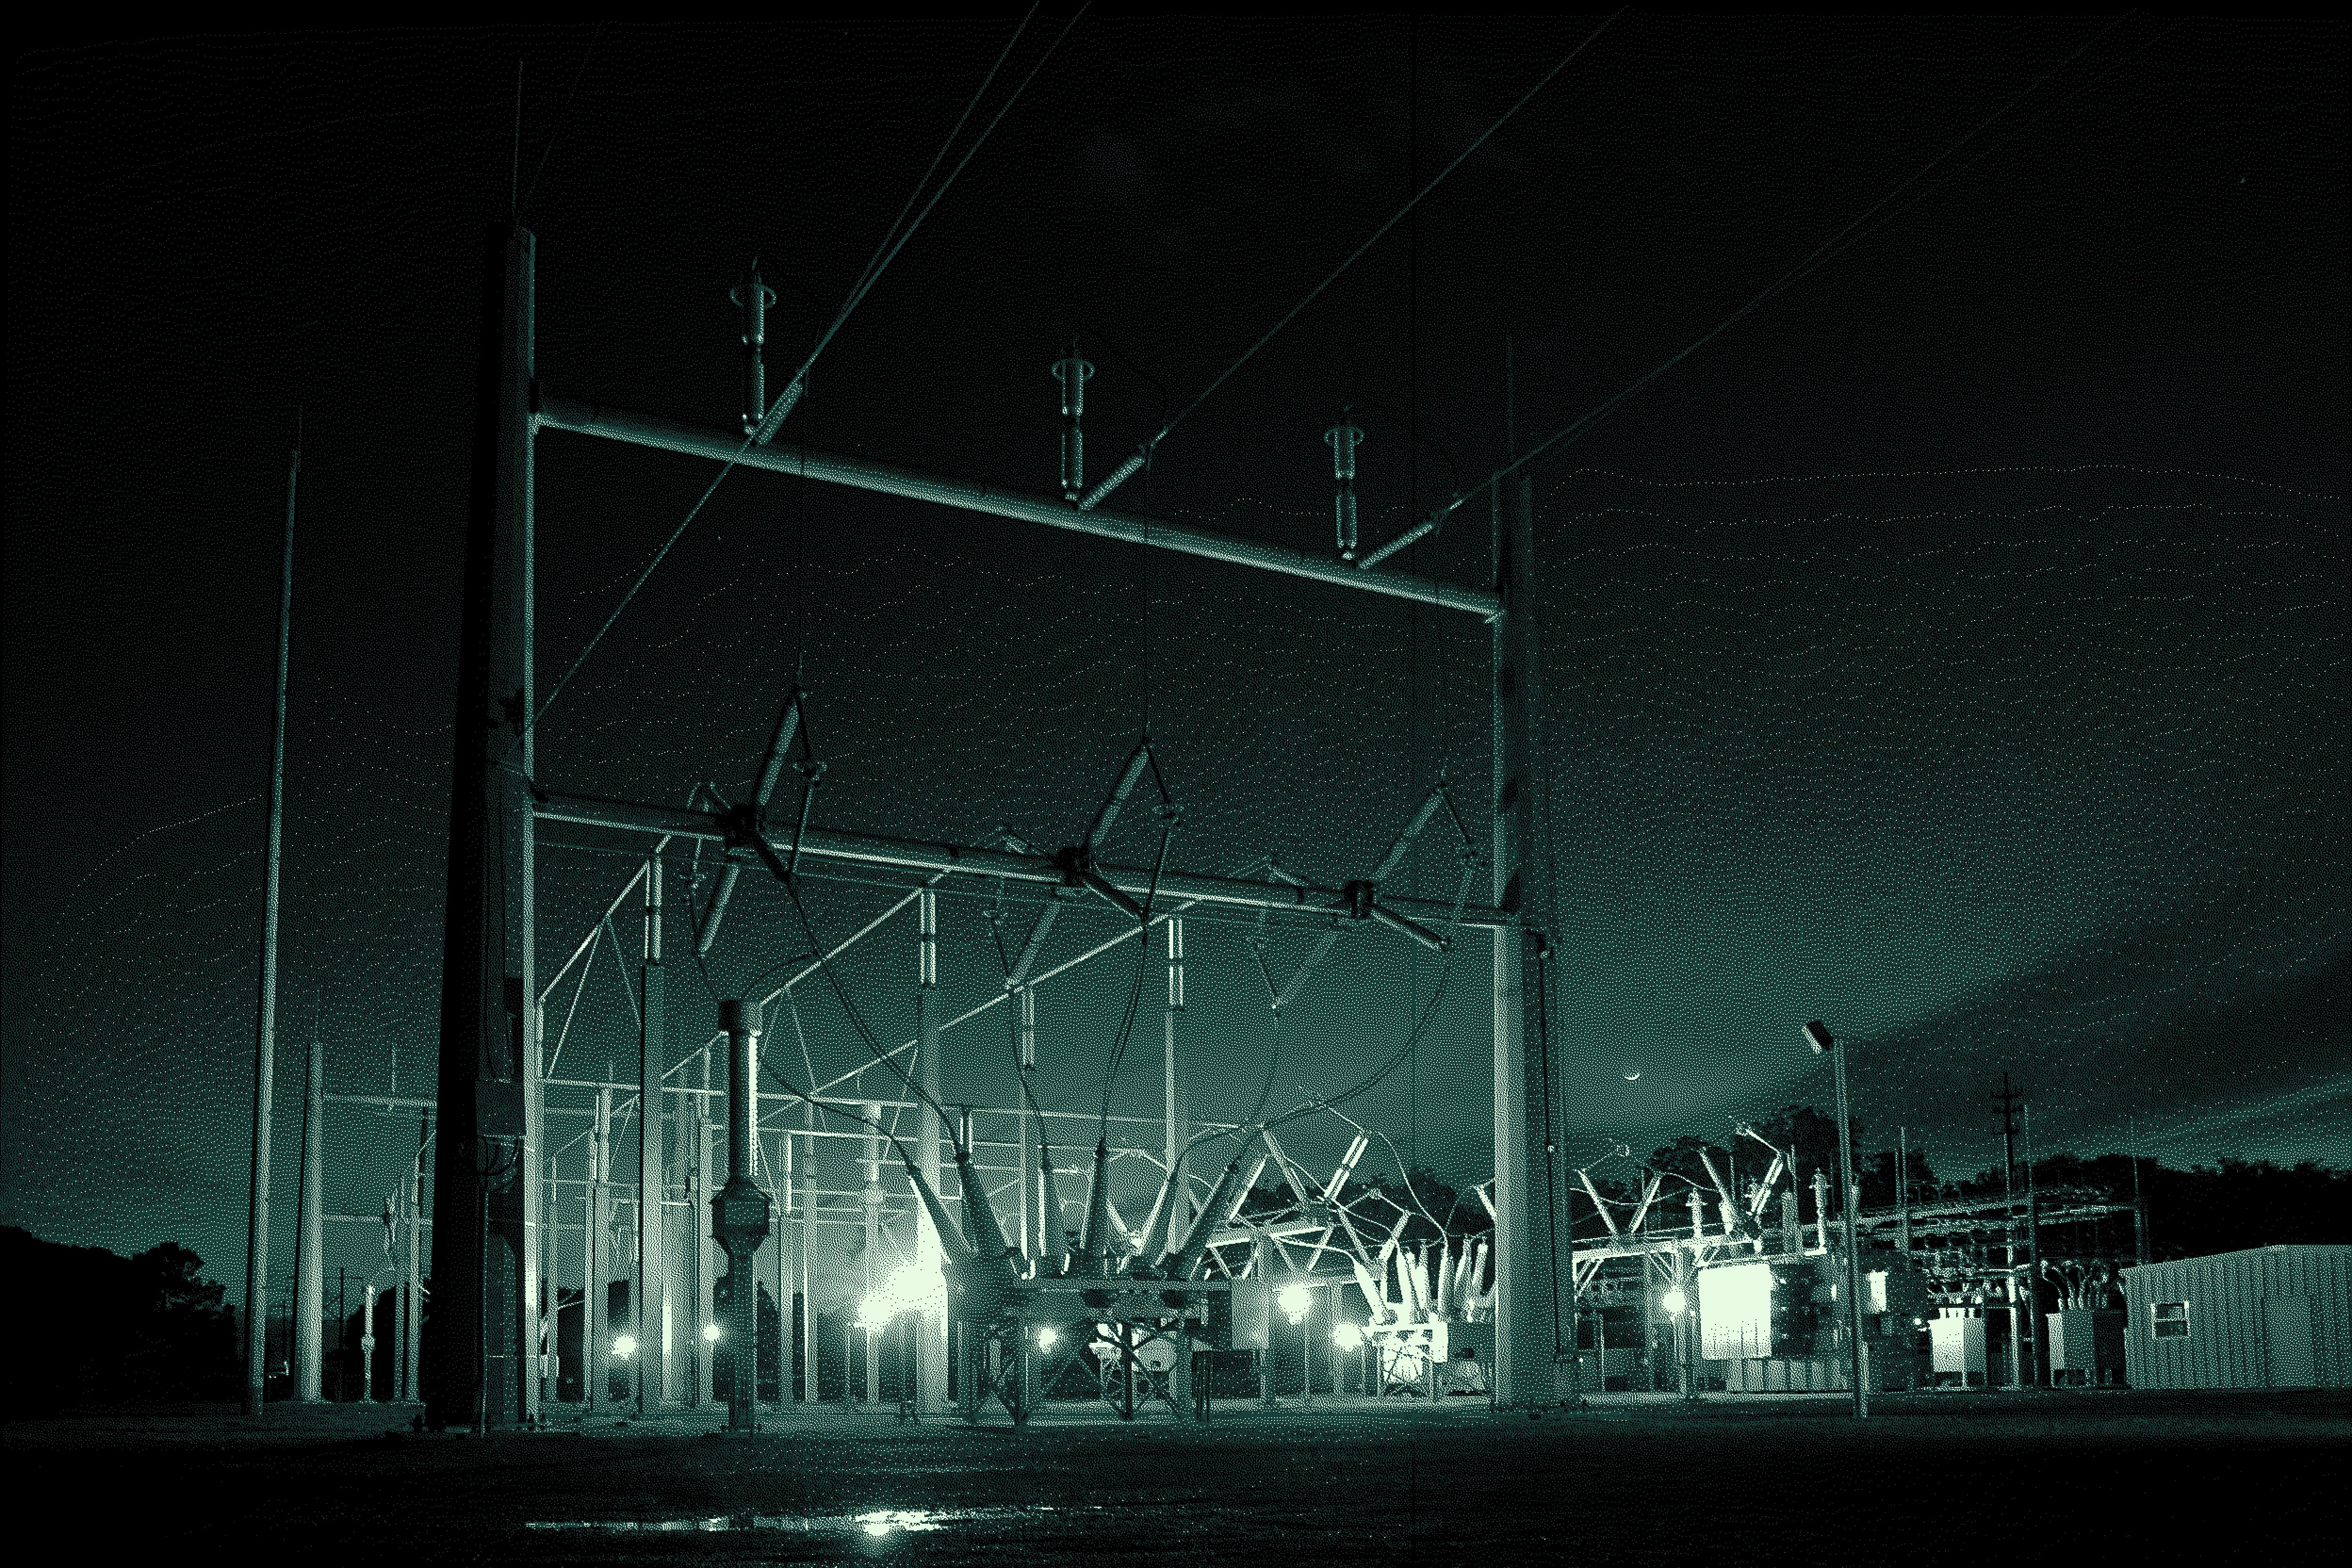
Utilities are running out of transformer capacity they already own.
Executive Summary
Three trends are driving this: unprecedented demand from data centers and electrification is forcing transformers to carry more load for longer, renewable and inverter-based generation is adding harmonic content that generates extra heat, and extreme weather is compounding both with higher ambient temperatures. Together, these forces compress the thermal headroom transformers have historically carried.
At the same time, insulation aging accelerates non-linearly with temperature. The Arrhenius relationship shows that every 6 to 8°C increase in hottest-spot temperature above the 110°C reference point cuts expected insulation life roughly in half.
Two-to-four-year lead times exacerbate this dynamic, forcing utilities to load their existing fleets harder. Harder loading accelerates the insulation aging that ends a transformer's life. The shortage consumes the very assets that are covering for it. Because a replacement cannot be bought, the transformer already in service does the work of two. Every hour it covers for the one that can't be bought, it becomes the next one that can't be replaced. This is the Chaturvedi paradox.
Utilities manage this cycle with a blunt instrument. They apply conservative, static nameplate ratings uniformly across the fleet. That approach is safe on balance, but strands capacity. Some transformers carry material thermal and mechanical margin that never gets used, because no one can see it asset by asset. Others carry far less margin than their rating implies and keep getting loaded as if they don't. Both errors are expensive. Both are hiding inside fleets utilities already operate.
VIE's platform closes this gap with continuous, physics-based fleet intelligence. VIE's solution fuses triaxial vibration, thermal, magnetic field, and local weather to generate a live, asset-specific profile of mechanical and thermal condition across a fleet. For the first time, utilities can identify where latent capacity can be safely recovered and where load must be reduced before it consumes insulation life.
This is a fundamentally new operational capability: continuous, fleet-scale capacity recovery. Not periodic assessment. Not static ratings. Continuous identification of recoverable capacity and emerging constraints, drawn from the true operating condition of every monitored asset. Only VIE maintains a live, fleet-wide view of real asset condition. That is why only VIE can deliver capacity recovery at fleet scale, continuously, without sacrificing reliability or asset life.
Thermal Headroom Is Shrinking From Three Directions
Transformer ratings define the margin between normal operating temperature and the point where insulation aging accelerates sharply. Those ratings were set decades ago, against load forecasts and grid conditions that no longer hold. Three trends are now compressing the margin they assume.
Load growth
Data center demand, electrification of heating and transportation, and industrial reshoring are driving sustained loading. This loading runs well above the profiles many transformers were designed and rated against. Sustained higher loading means sustained higher hottest-spot temperature, substantially accelerating deterioration of the insulation system.
Renewables and power-electronics-heavy load
Distributed solar, EV charging, and other inverter-based generation and load add harmonic content to the current a transformer carries. Harmonic currents drive additional eddy-current and stray losses inside the winding and structural steel. These losses scale faster than the fundamental-frequency load alone would suggest. A transformer can therefore run measurably hotter than its nameplate loading implies, even when the metered kVA looks unremarkable.
Extreme weather
Higher ambient temperature adds directly to hottest-spot temperature. It tends to arrive at the same time as peak demand, when air conditioners are running and EVs are charging, and when a utility can least afford to de-rate the asset.
All three trends converge on the same variable: winding hottest-spot temperature. This is the temperature at the single hottest point inside the winding, not an average.
The Arrhenius Relationship: Why a Few Degrees Matter So Much
Transformer insulation is paper and oil. Both degrade chemically over time. That degradation follows an Arrhenius-type reaction rate. The rate of a temperature-driven chemical reaction increases exponentially with temperature, not linearly. IEEE C57.91 is the industry loading guide for mineral-oil-immersed transformers. It formalizes this into an aging acceleration factor, FAA, referenced to a hottest-spot temperature of 110°C:
Aging acceleration factorFAA = exp [ 15,000 / 383 − 15,000 / (TH + 273) ] TH is the winding hottest-spot temperature, in °C.
At 110°C, FAA equals 1.0. The insulation ages at its designed, normal rate. Above 110°C, life is consumed faster than calendar time passes. Below it, life is consumed more slowly. The relationship is exponential, so the effect compounds quickly:
This is why small, sustained temperature increases carry outsized consequences. A transformer running 16°C hotter than its reference point is not aging 16 percent faster. It is aging roughly 400 percent faster. Load growth, harmonic losses, and extreme ambient temperature don't just add stress independently. They compound on the same exponential curve, at the same time.
The Chaturvedi Paradox
The loop works like this. Before 2020, lead times for large power transformers ran 7 to 14 months. They now commonly run 24 to 48 months. Distribution transformer lead times have stretched from roughly 12 weeks to 30 to 50 weeks over the same period. A utility that cannot buy new units has one option: work the fleet it already owns harder. The added duty pushes hottest-spot temperatures up. Under the Arrhenius relationship, higher temperature accelerates insulation aging and pulls end of life closer. The shortage forces the fleet to cover. Covering consumes the fleet. The loop feeds itself.
This is not a failure of any single utility's practice. It is a mismatch between the physics of insulation aging and the economics of equipment supply, and it applies to every fleet operating under today's load and climate conditions.
The Chaturvedi ParadoxEvery hour a transformer covers for one you can't buy, it becomes the next one you can't replace.
The Cost: Stranded Capacity
A utility facing this paradox has two ways to be wrong. Today's tools cannot reliably tell the two apart.
It can under-load a transformer that actually has real thermal and mechanical margin. A conservative, fleet-wide nameplate rating is the only tool available. Margin that isn't visible asset by asset gets treated as if it doesn't exist.
It can continue loading a transformer that has quietly lost margin. Age, nameplate rating, and a DGA sample taken months or years ago cannot show what is happening inside that unit today, under this week's load and this week's weather.
The first error strands capacity the utility has already paid for. Interconnection requests sit in queue longer than necessary. DER hosting capacity is left on the table. Load growth gets turned away, or routed to a new build, when an existing asset could have absorbed it safely. The second error strands something more expensive: the remaining life of a transformer the utility cannot quickly replace, spent without anyone deciding to spend it.
Both errors point to the same root cause. Capacity planning and risk management are still built around a rating that was fixed once, at commissioning. That rating is never updated against how the asset actually behaves in the field.
What this looks like at fleet scale
This scenario is illustrative, built from representative fleet assumptions, not a specific customer result. It shows the order of magnitude of what static, uniform ratings leave on the table.
Why the Current Toolkit Can't Resolve It
Static nameplate ratings and loading guides
IEEE and IEC loading guides are conservative by design. They describe safe operating envelopes for a population of similar assets under assumed conditions. They were never meant to be a real-time picture of one specific transformer's condition under current load and ambient temperature.
Age-based replacement planning
Calendar age correlates poorly with actual remaining life. A transformer well within its design life on paper can carry more mechanical and thermal risk than a unit twice its age depending on duty cycle, load history, and manufacturing variance. Planning capital and load decisions around age alone misallocates both.
Periodic oil sampling and DGA
Dissolved gas analysis remains the trusted, industry-standard indicator for gas-generating electrical faults: arcing, partial discharge, and thermal decomposition of oil and paper. It is not designed to run continuously across an entire fleet. It also says little about mechanical and structural conditions, the failure modes that generate no gas at all. DGA tells a utility what happened between samples. It was never built to show where margin exists right now, fleet-wide, continuously.
VIE's Answer: Continuous Fleet Intelligence
VIE replaces the static, one-and-done rating with a continuously updated, asset-specific profile that is ranked across the entire fleet. This approach provides a fleet-wide capacity overview in addition to predicting asset-level failures. The platform fuses four proprietary signal streams on every monitored unit. Each signal closes a blind spot conventional methods cannot see, and that the other three cannot cover:
Machine learning turns these four fused signals into a type, severity, and trajectory for each detectable failure mode: electrical, mechanical, and thermal. A human-in-the-loop analyst model supports this process. The platform recommends confirmatory diagnostics where appropriate. Findings are load-corrected and seasonally normalized, so the same asset can read differently in August than in February.
From Health Monitoring to Capacity Recovery
At VIE, we believe transformer health monitoring and capacity recovery are not two different products. They are two outputs of the same continuously updated, fleet-ranked condition picture. The same foundation that flags an emerging fault early also identifies which transformers can safely absorb more load, and which need load taken off before they lose insulation life the utility cannot afford to spend. A fleet where condition is visible, asset by asset, continuously, is a fleet where capacity can be actively managed instead of conservatively assumed.
Fleet intelligence turns a static nameplate MVA number into a live answer: how much of this asset's real capacity is actually available today, and where in the fleet is that capacity sitting unused.
In practice, that means:
Planners get a fleet-ranked view of usable margin, instead of a spreadsheet of nameplate ratings and in-service dates.
Operations gets clear, red, yellow, green style alerting when an asset's real condition changes. Load can be shifted before insulation life is spent, not after a failure confirms it.
Capital planning can target the fraction of the fleet that genuinely needs attention. Recovered capacity on healthy assets can defer or avoid new-build procurement, in a market where large power transformers now take two to four years to deliver.
Conclusion
Every hour a transformer covers for one you can't buy, it becomes the next one you can't replace. This is not a temporary supply chain problem. This is a compounding spiral between the physics of insulation aging and the economics of transformer replacement. Utilities cannot shorten lead times, and they cannot suspend the Arrhenius relationship. They can now interrupt the spiral by dynamically reallocating load across the fleet to match asset-level capacity.
Closing that gap requires seeing every transformer's actual condition, continuously, fleet-wide, and asset by asset. That is what VIE's fleet intelligence platform is built to do: give utilities the ability to recover capacity they already own. VIE deploys this capability with utilities today. If your planning or operations teams are projecting capacity shortfalls, or navigating multi-year transformer procurement delays, let's talk. A preliminary Stranded Capacity Assessment can pinpoint where hidden headroom is sitting in your fleet, and where it isn't.